")
")
In 2013 the cement market fell 6% y-o-y, to 7.2 mln tons and €450 mln. Bulk cement share 53% in volume, and the largest consumers are ready-mix concrete plants. The installed cement production capacity amounted to 17.5 mln tons, of which 4.9 mln tons belong to Lafarge and 6.1 mln tons belong to Holcim. The competitive environment will become more effervescent along with sales of assets of Lafarge Romania. The cement market has high potential to growth in Romania, and during 2013-2020 InterBiz estimates a CAGR of 7%.

In 2013 the masonry materials market rose by 1% compared to 2012. In 2013 the masonry materials market in Romania reached 5.2 mln cm. The AAC and clay bricks accounted for 79%. In Romania there are 26 active producers of AAC and clay bricks. The utilization rate of production capacity was about 65%. On medium term we expect increasing financial allocations for improvement of productivity, expanding product portfolio and growth of regional competitiveness. Also, we expect market consolidation.

In July 2014 InterBiz | research & consulting improved and updated the analysis "Dry-mix Adhesives and Mortars Market, Romania, 2010-2020".
In 2014 the dry-mixtures market value will reach €270 mln (retail, VAT excluded).
The most dynamic segment within dry-mixtures market is the cementitious waterproofing mortar, and during 2010 - 2013 recorded a CAGR of 8%.
The potential of domestic consumption is 3.2 mln tons, but could not be reached before 2020. According to plans of market players production capacity could reach 6.9 mln tons, much over-capacity related to potential consumption.
In 2013 the construction market fell 3% comparing to 2012, to €16.1 bln, of which Gross Value Added (GVA) amounted to €11.3 bln. The share of construction in GDP formation was 7.9% in 2013, but in 2014 will rise to 8.1%. InterBiz analysis reveals a very high growth potential of the construction sector. To reach the average EU Romania needs investment in construction of buildings and civil engineering worth ~ €150 bln. For example, in transport infrastructure Romania should have ~3,900 km of highways, by 3,250 km more than now.
In 2013 the milk and dairy market in Romania rose 8% in volume and 12% in value (y-o.y). Overall, during 2009 - 2013 the dairy market recorded a CAGR of only 3% in value, well below the rate recorded in 2004 – 2008 (CAGR 21%). The growth rate is in line with the estimates in our report in April 2009. If we compare the consumption of industrialized milk & dairy in Romania to the EU 27 average, then results a growth potential of almost 4 times for Romania. By 2016 the realistic scenario of InterBiz shows that the dairy market will reach €1.6 bln in retail, CAGR of 1% in EUR. The dairy market highlighted the trend of suppliers to offer diversity of products, innovation for consumers, new opportunities combined with modern consumer trend.
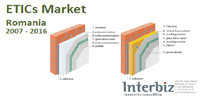
In 2012 the ETICs market remained stable to 38 mln sqm, according to InterBiz research. The most used product for thermal insulation system is EPS, while stone wool shared less than 1%. The thermal insulation system applied for new buildings share 34% and retrofitting works share 66%.
For further details concerning the report “Thermal Insulation Market (ETICs/EIFS), Romania, 2007 – 2016” completed in June 2013 and terms for purchasing please send a request to Adrian.Iordache@interbizgroup.ro or call +40721.268.653.

The energy and petroleum products market value accounted 16% of GDP in 2011, down by 5 percentage points comparing to 2005. By 2020 the market should double to €39 bln. For the next eight years the main challenges of the energy market are linked to the new development strategies; turn to value the potential of RES, gas supply on free market, investments and improvement of central heating networks, the price of oil, population’s behavior and trends of economy by sector.

The turnover of TOP 300 non-financial companies of Romania reached €95.8 bln in 2014 (![]() 1.2% comparing to 2013).
1.2% comparing to 2013).
Top 300 companies recorded 40% of total aggregate turnover of all companies in Romania in 2014. The weight of Top 300 in GDP was 63.8% in 2014, decreasing from 66.6% in 2013.